Revision of Basic Statistics
Types of Data
- Continuous Data→ Data that can take any value in an intervall (also float, numeric, interval data)
- Discrete Data→ Data that can take only integer values (also integer, count)→ is our most used data type
- Categorial Data→ Data that can take only predefined values representing a set of categories (also enums, enummerated, nominal data)→ Special case: binary data (also boolean, logical indicator)→ Ordinal Data: Categorial data with explicit ordering (e.g. small, medium, large)
! in our models, we have to deal with the type of data. Continuous Data and discrete data is easier than ordinal data
Simple Statistical Characteristics
- mean / average→ trimmed mean: removes potential outliers→ weighted mean: what weight (factor) is given by some prior information, e.g. trust in the source
- median (middle element of set)→ much more expensive to calculate (need to sort first)
- variance→ measure for variability, how far a set of numbers are spread out from the mean→ it is mandatory for us to look at the variance
- Standard Deviation→ is closly coupled with variance→ is the spread of a group of numbers from the mean
- Range→ difference between maximum and minimum values
- Percentile→ a value such that p percent of the values take on this value or less
→ with the given characteristics, we can create
- Box-Plots, visualizing mean and quantile and outlier information
- Histograms, visualizing data distribution (bin count)
(based on numerical data, not possible with categorial data)
Multivariate Statistics
→ characteristics we can get for the relation between variables
- Covariance→ measure of the joint variability of two random variables (If one variable goes up, does the other also go up? Yes → Covariance is positive)→ Covariance Matrix
- Correlation→ how a pair of variables are related (e.g. linear)→ is the normalized covariance
- most famous: Person’s correlation coefficient
- Correlation does not implicate causality (e.g. rain → umbrella, but not umbrella → rain
- Simpson Paradox→ an effect in which a trend appears in several different groups of data but disappears or reverses when these groups are combined.
Data Sampling
- how to sample data for experience?
- how much data do I need?
- But I have Big Data- do I still need to sample?
Terms:
- Sample: a subset of a larger data set
- Population: the large (full) data set – or at least the model for it
- Random Sample: Drawing samples at random
- Stratified sampling: Dividing samples into
- strata (groups with shared properties) and sample from them
- Sample Bias A sample that has different statistics from the population
We need to prevent sample bias!
→ e.g. with random sampling
Rules for random sampling:
- define theoretically possible populations
- what external effects could influence the population (e.g. different sources)
- need context knowledge on the data source!
- compare basic statistics of different samplings (Mean, Variance, …) is it stable?
- but this will require more data …
Alternative: Bootstrap Sample
→ a sample which has been taken with replacement
- replacement: a data point can be drawn more then once
- algorithm:
- sample data points with replacement save sample as bag
- compute statistics (e.g. mean, variance)
- repeat 1+2 and observe statistics of different bags
- effect of bootstrap: allows robust estimation of unknown distributions
- later for prediction: use bagging (= average over models trained on many bags)
Data Distributions
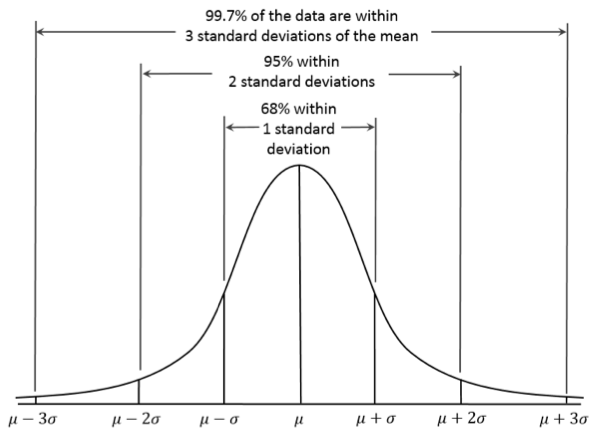
Normal Distribution
→ how much of the data is within the standard deviations
The assumption that data follows a normal distribution is
- a necessary condition for many analysis methods
- but rarely secure for real data
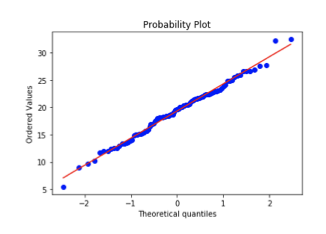
Testing for a Normal Distribution:
- many different approaches
- easy method: QQ-Plotsgraphical method for comparing two probability distributions by plotting their quantiles against each other.→ the more the points align themselves on the line, the better is the normal distribution

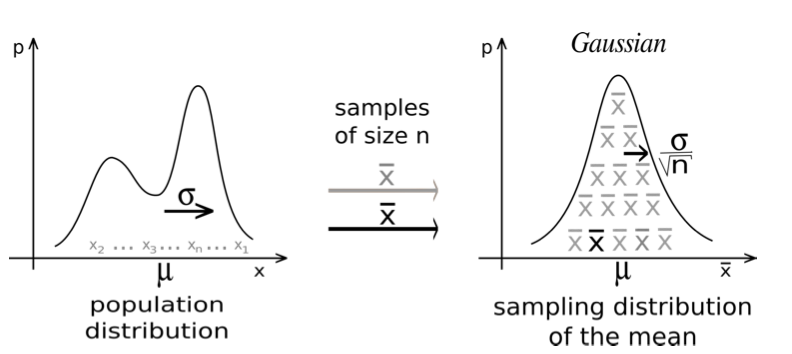
Why we can often assume a normal distribution:
→ because of the central limit theorem (CLT), which says that when independent random variables are added, their properly normalized sum tends toward a normal distribution (even if the original variables themselves are not normally distributed)
Data Wrangling
- What is Data Wrangling
- Stages
- Short Introduction to Pandas (Lab)
- Wrangling by Use Cases (Lab)
What Wrangling is
- in our Data Science Processing Pipline, it’s the step of “pre-process and cleaning”
- is the process of transforming and mapping data from one “raw” data form into another format which we can analyse
Stages of Data Wrangling:
(sometimes are not all steps needed)
- (Scrape) → get data from sensors, internet, databases,…
- Clean → remove “bad” data (missing values, wrong format, exceptions, special cases,….)
- Transform → change/correct data formats, recompute,…
- Merge → combine and connect data sources
- Reshape → Rectify, output: vectors, arrays, tables
How we do data wrangling:
- mostly in pandas, a python library
- central element of Pandas is DataFrame
more about pandas:
- Link to notebooks
Code Exercises
(Links to Github)
pandas
pandas_InputOutput_week3.ipynb
pandas_MissingData_week3.ipynb
pandas_MergeandJoin_week3.ipynb
Pandas_Group_by__Split_Apply_Combine.ipynb